Data visualisation
I bring data to life for both experts and novices — making it engaging, meaningful, and usable for action and decision-making.
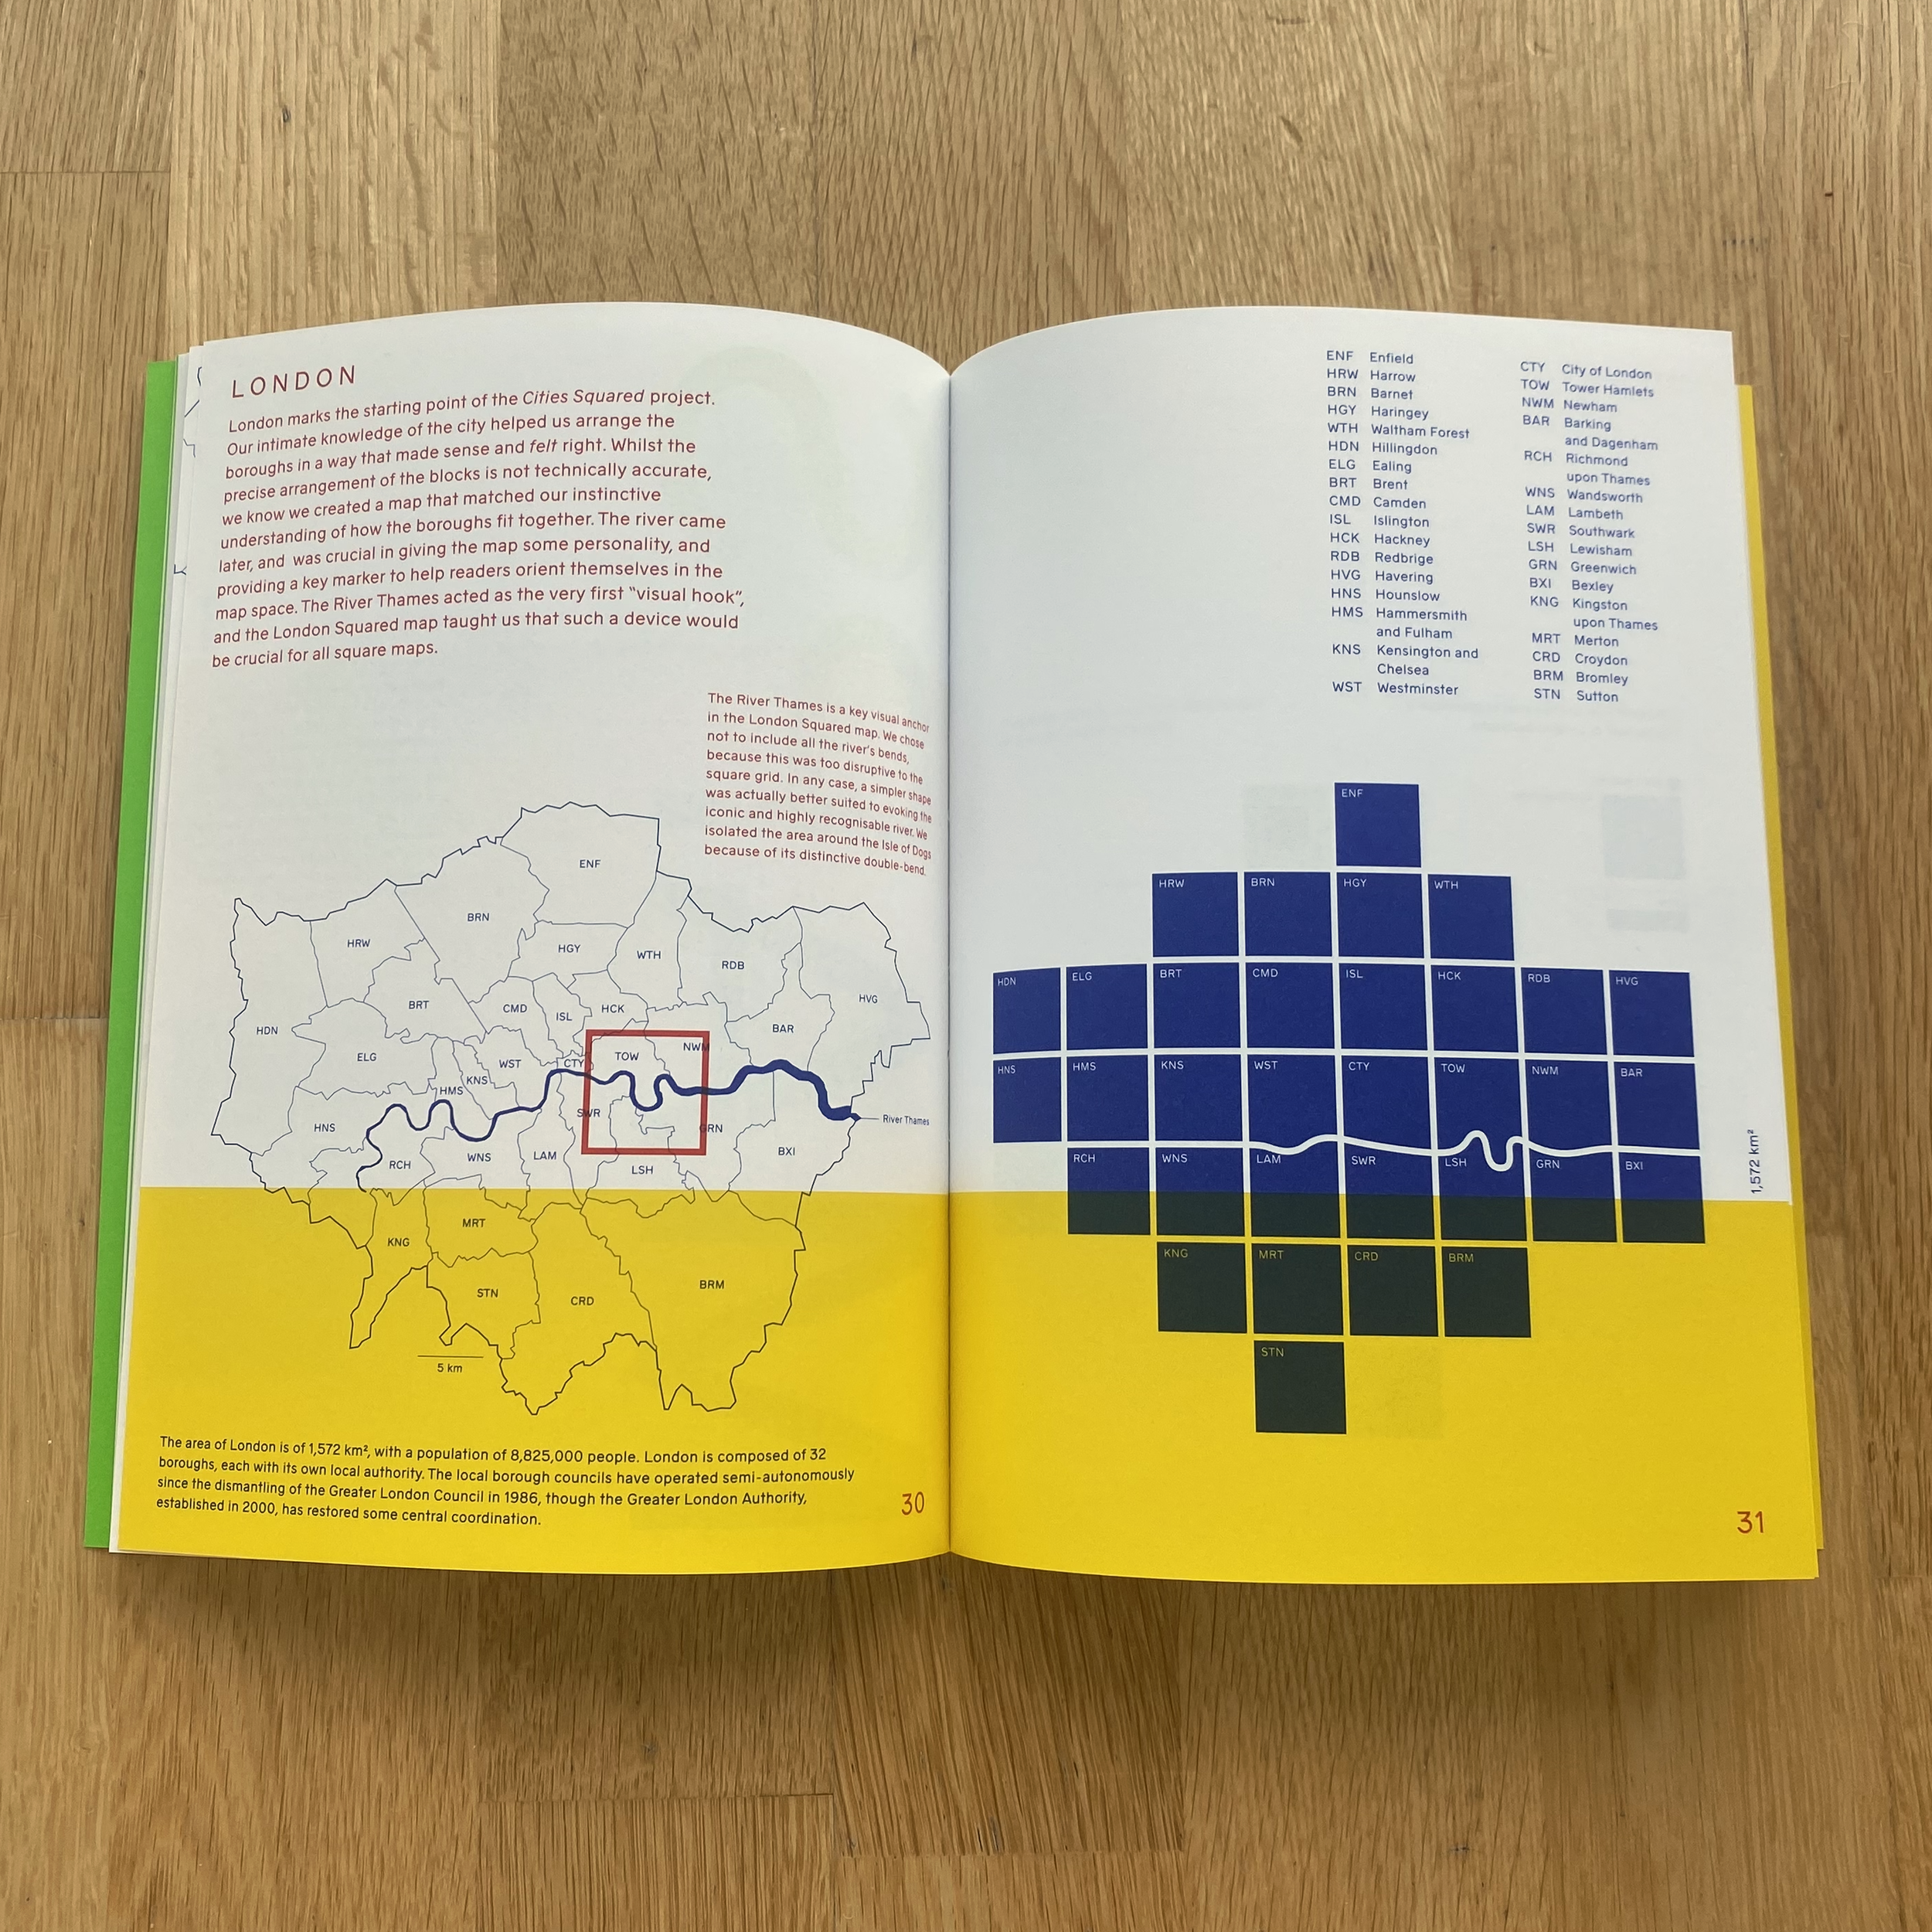
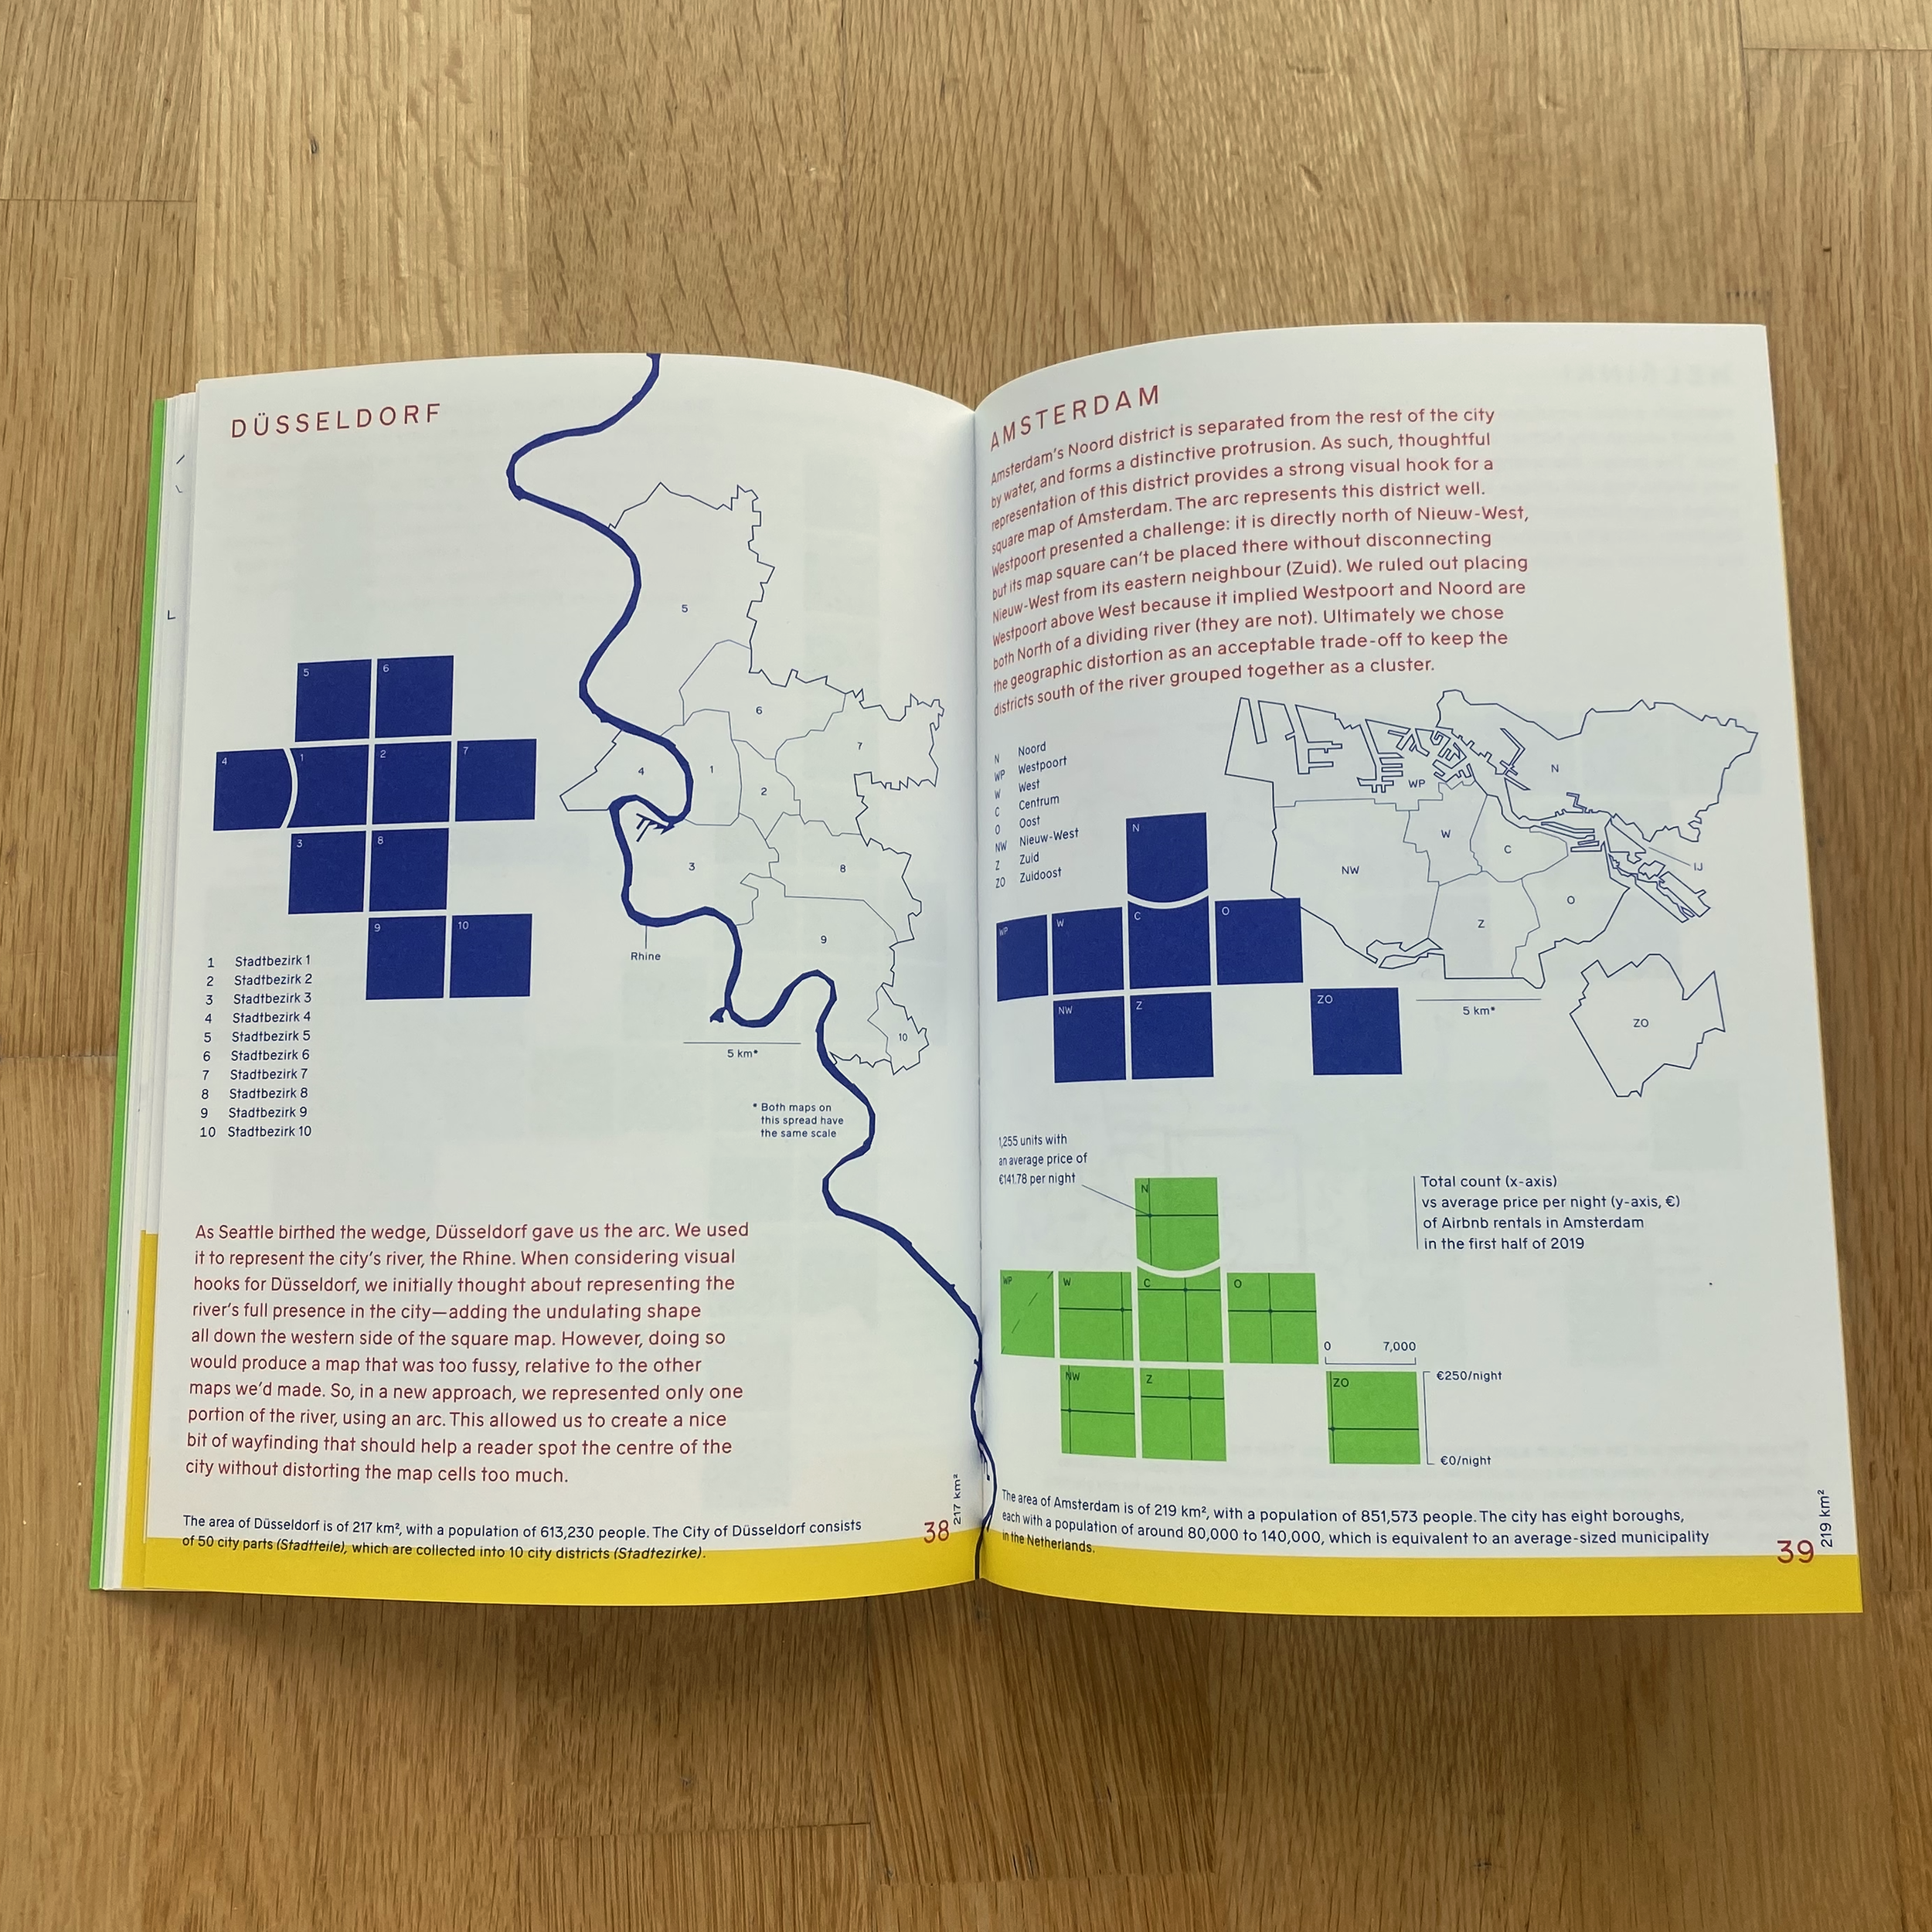
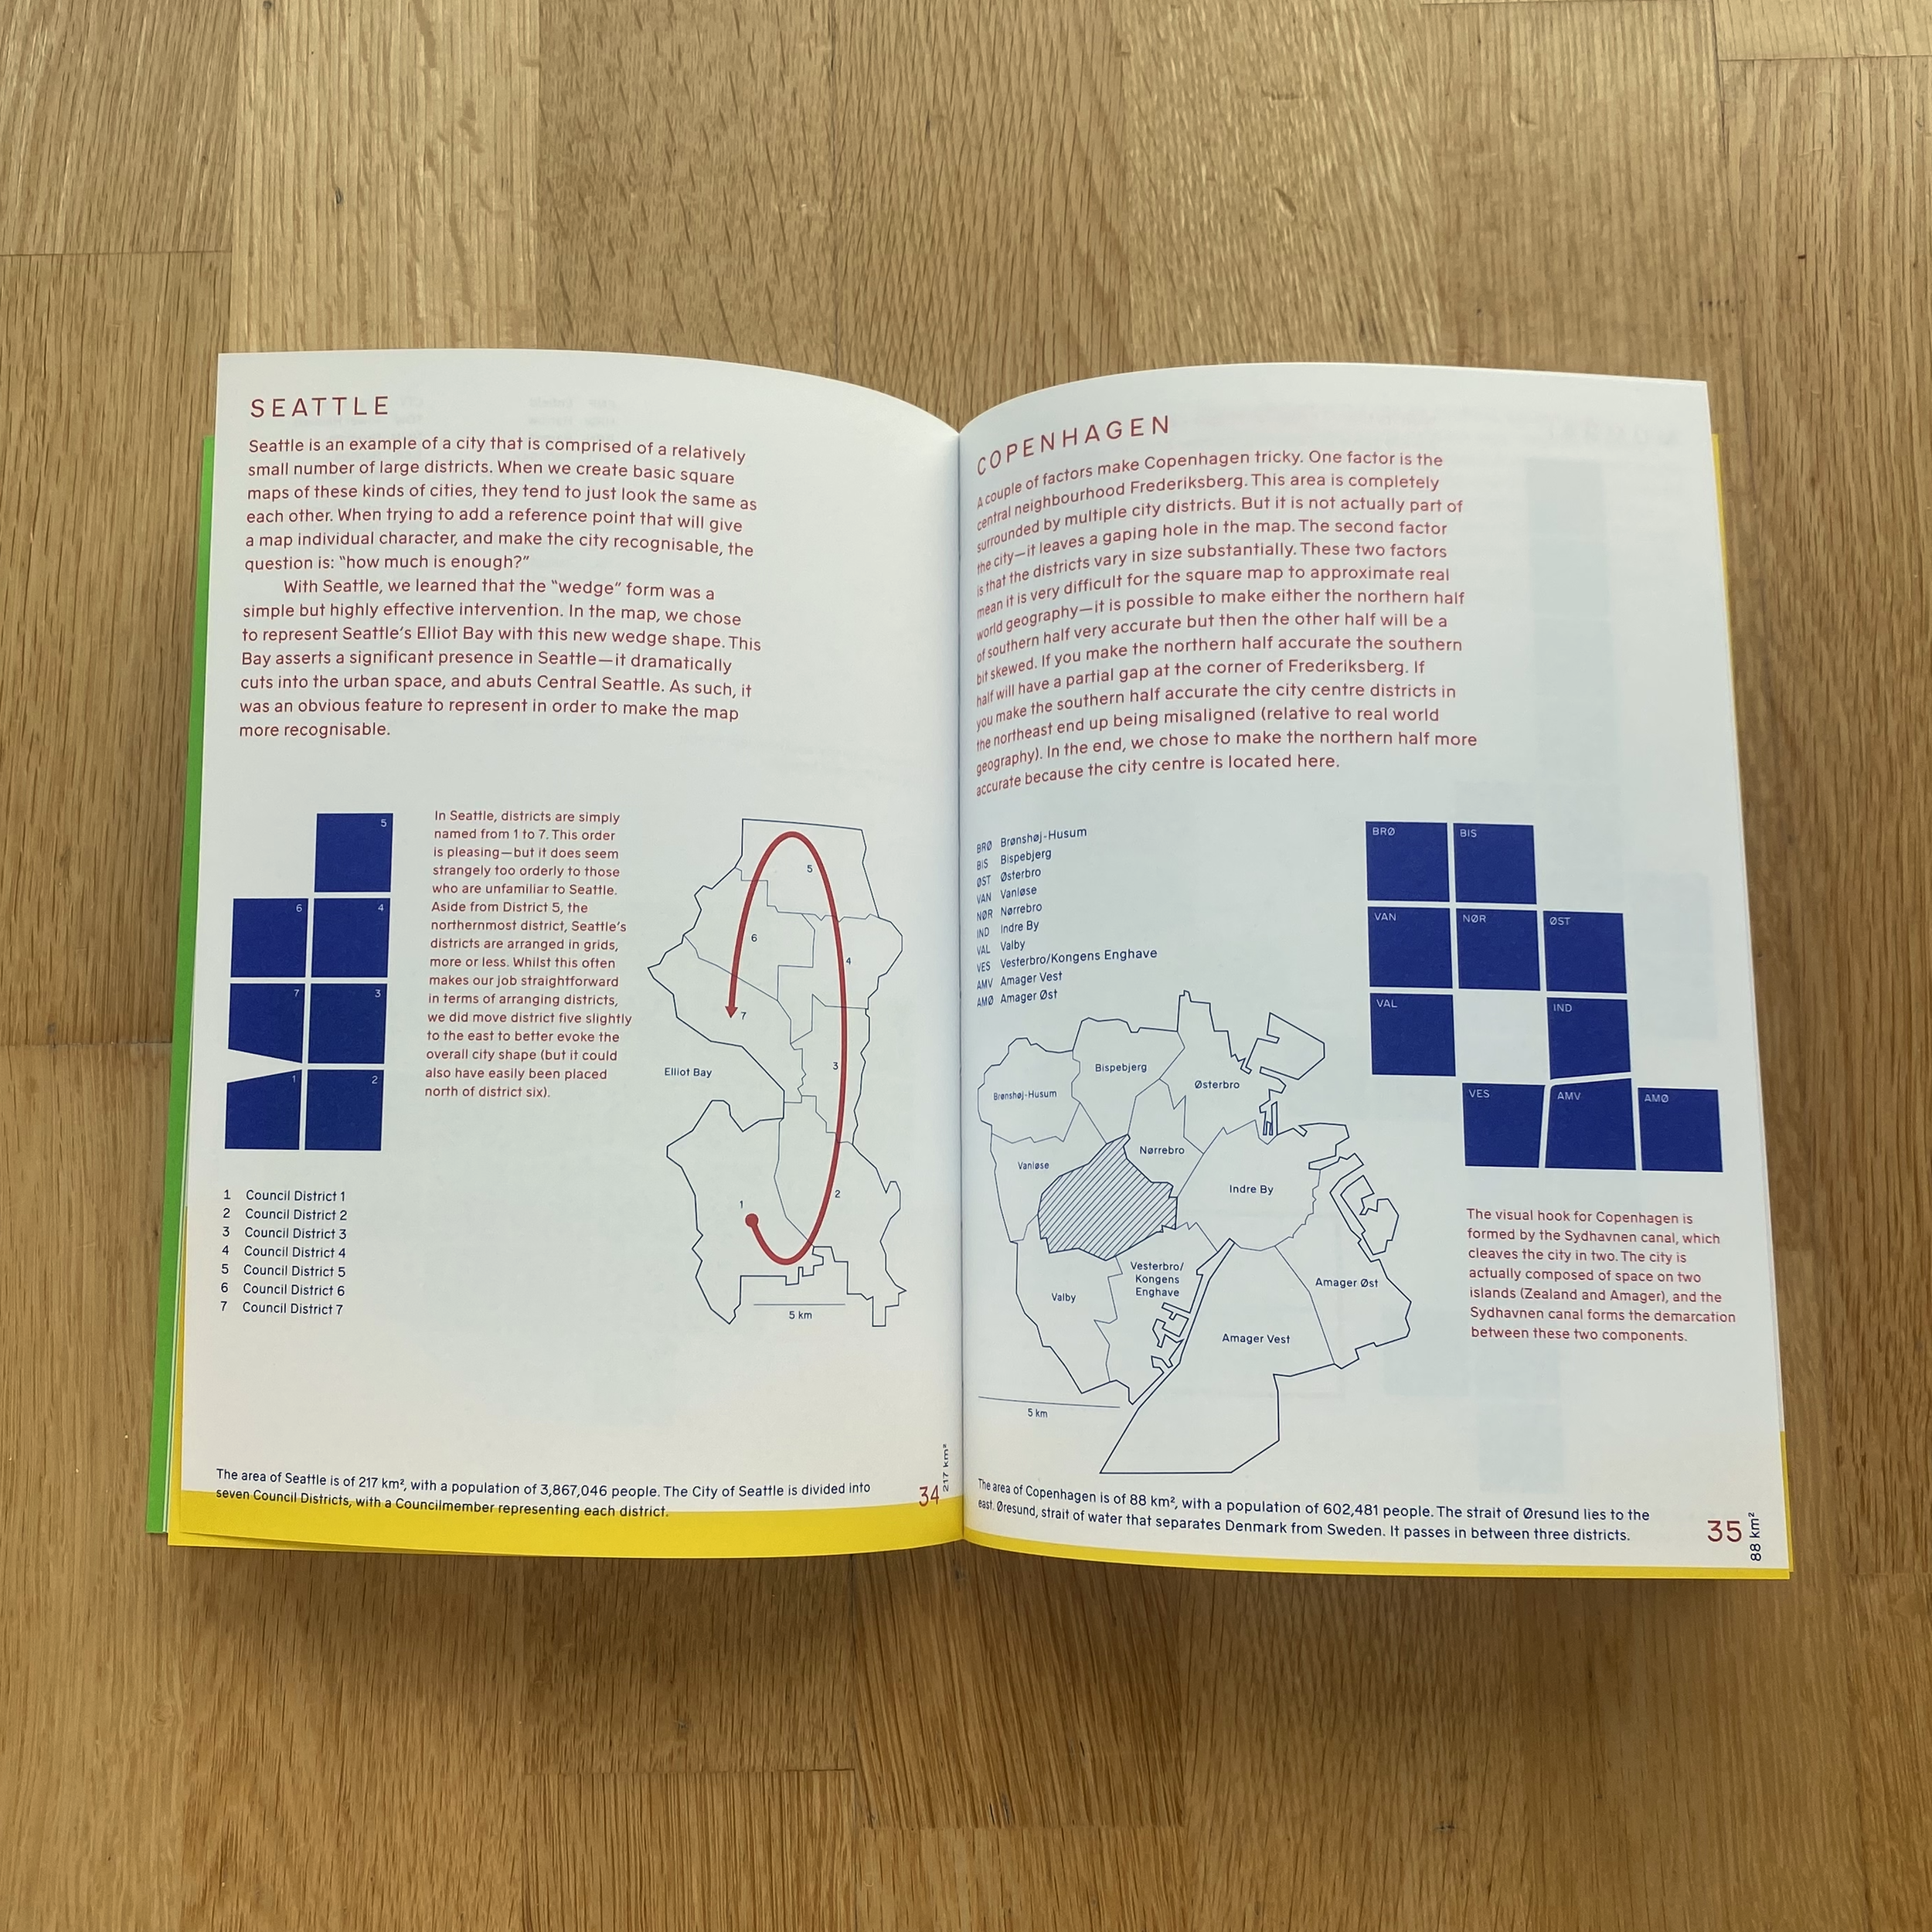
London Squared maps
Starting with a better way to show district data in London, we grew the mapping system to fit with other global cities.
Client
Future Cities Catapult

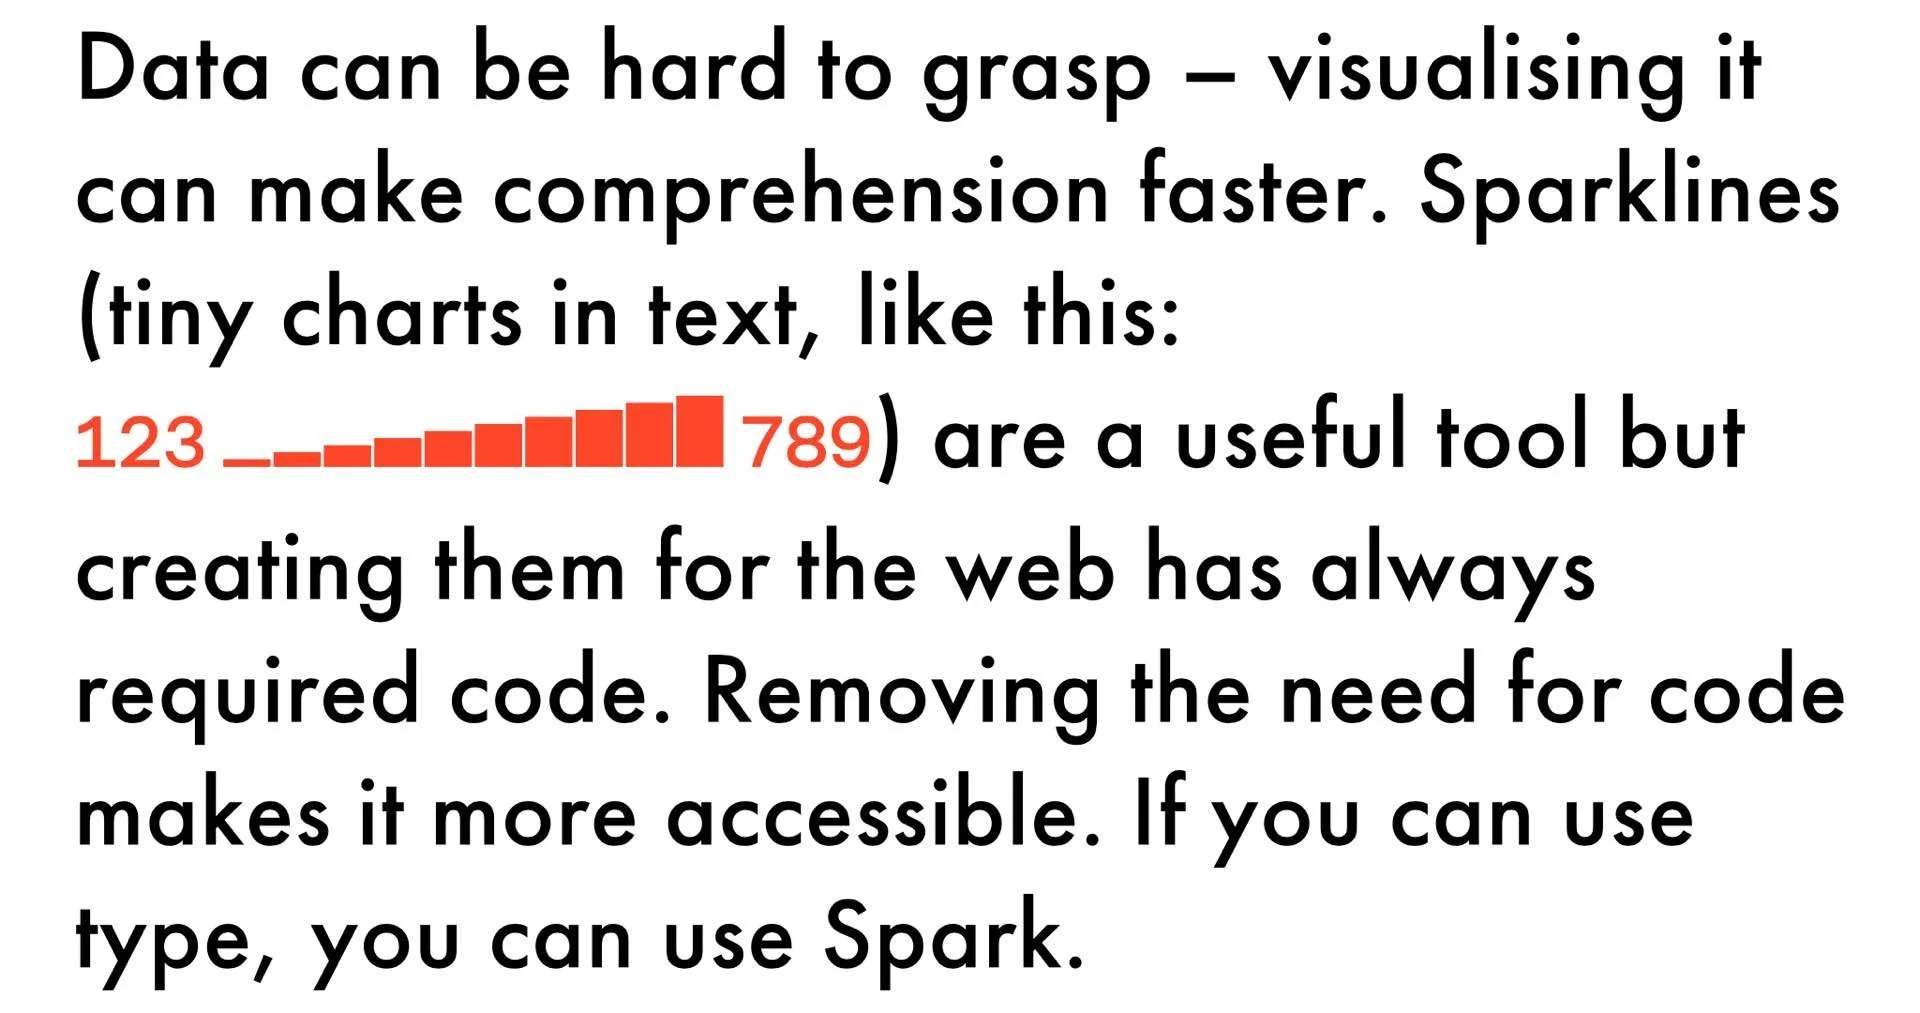
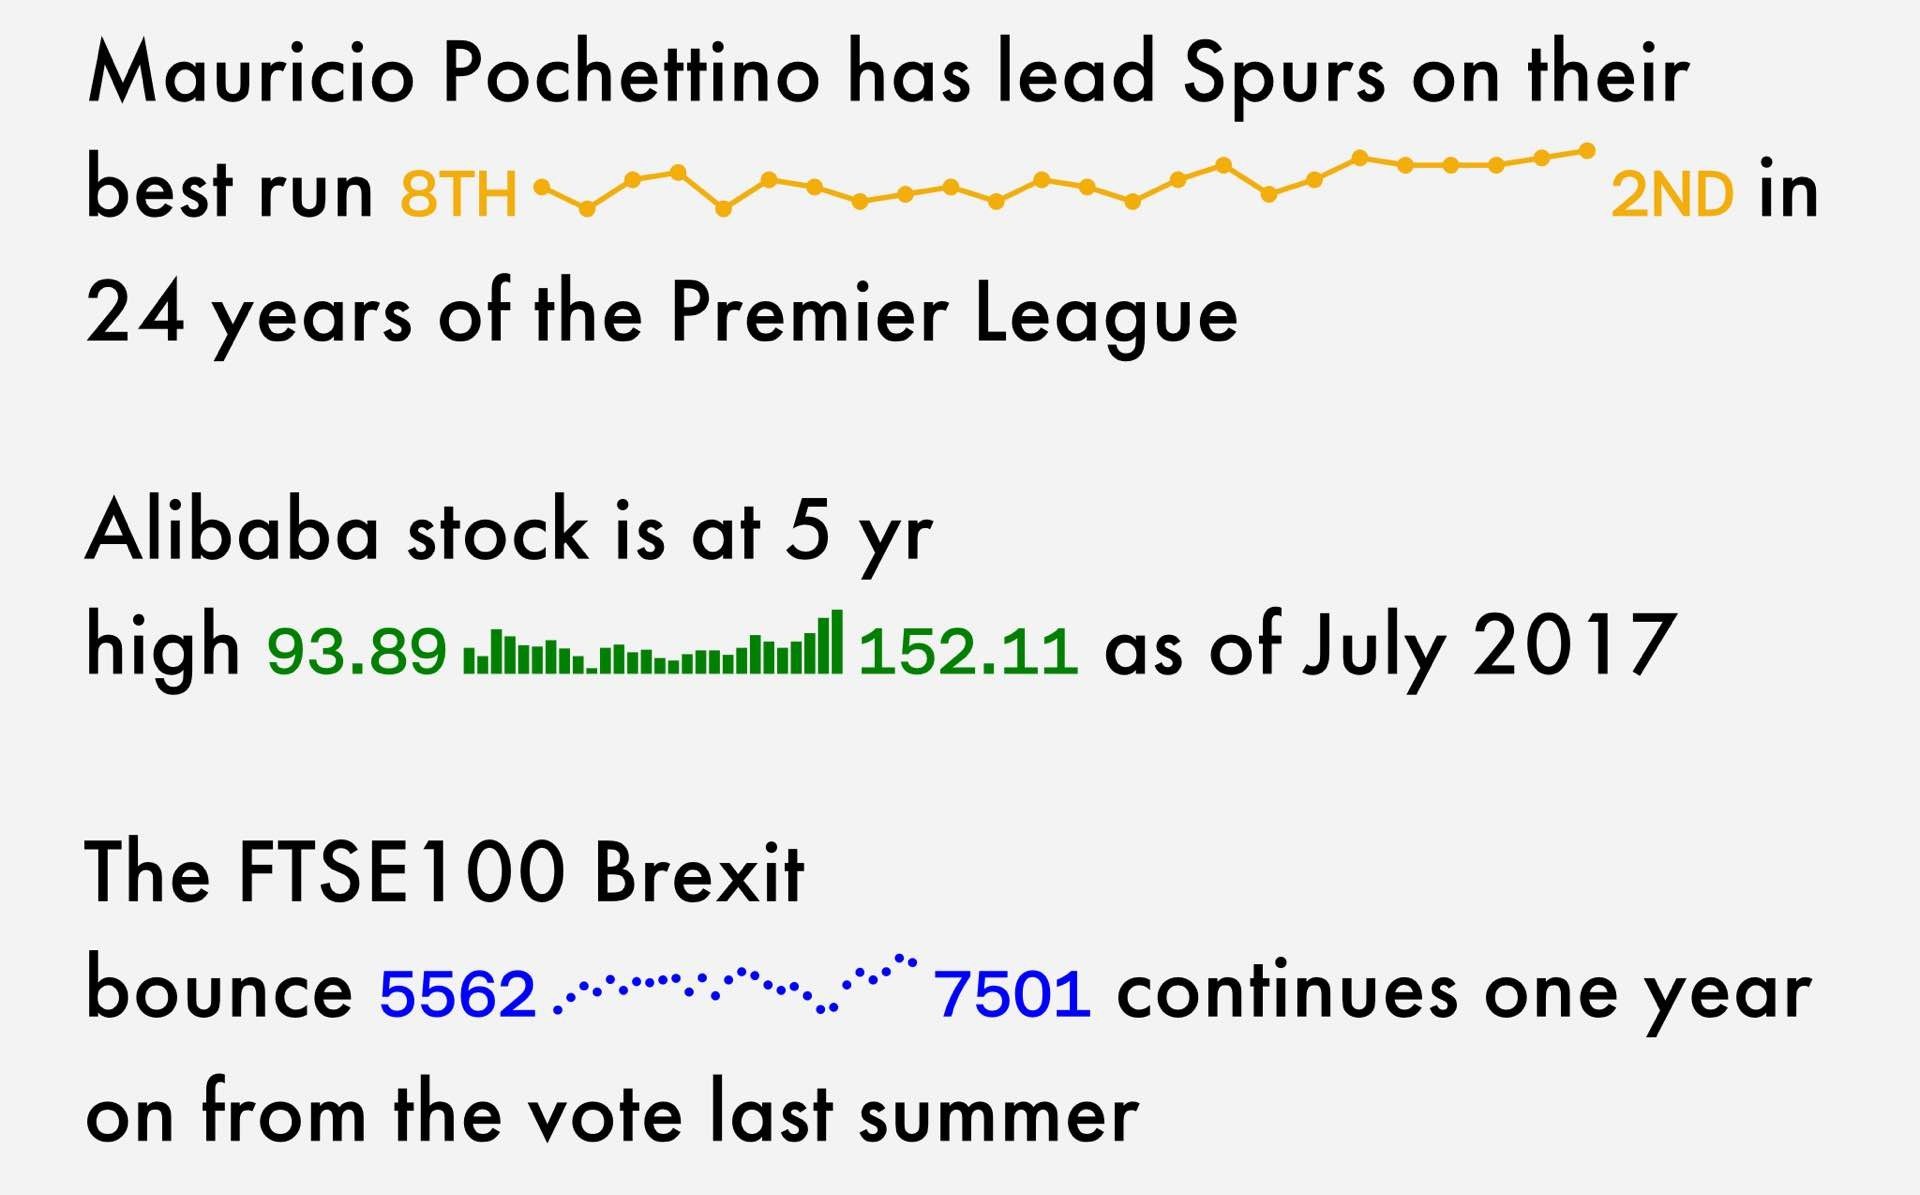
Spark - a sparkline typeface
To help editorial and financial teams intergrate quantitative data into qualitative content.
Client
Studio Project and Google Fonts

Systems in Motion (WiP)
A new tool for visualising systems, enabling users to collaborate on building interactive models and agreeing the parts, weights, factors, and flows.
Client
Self-initiated


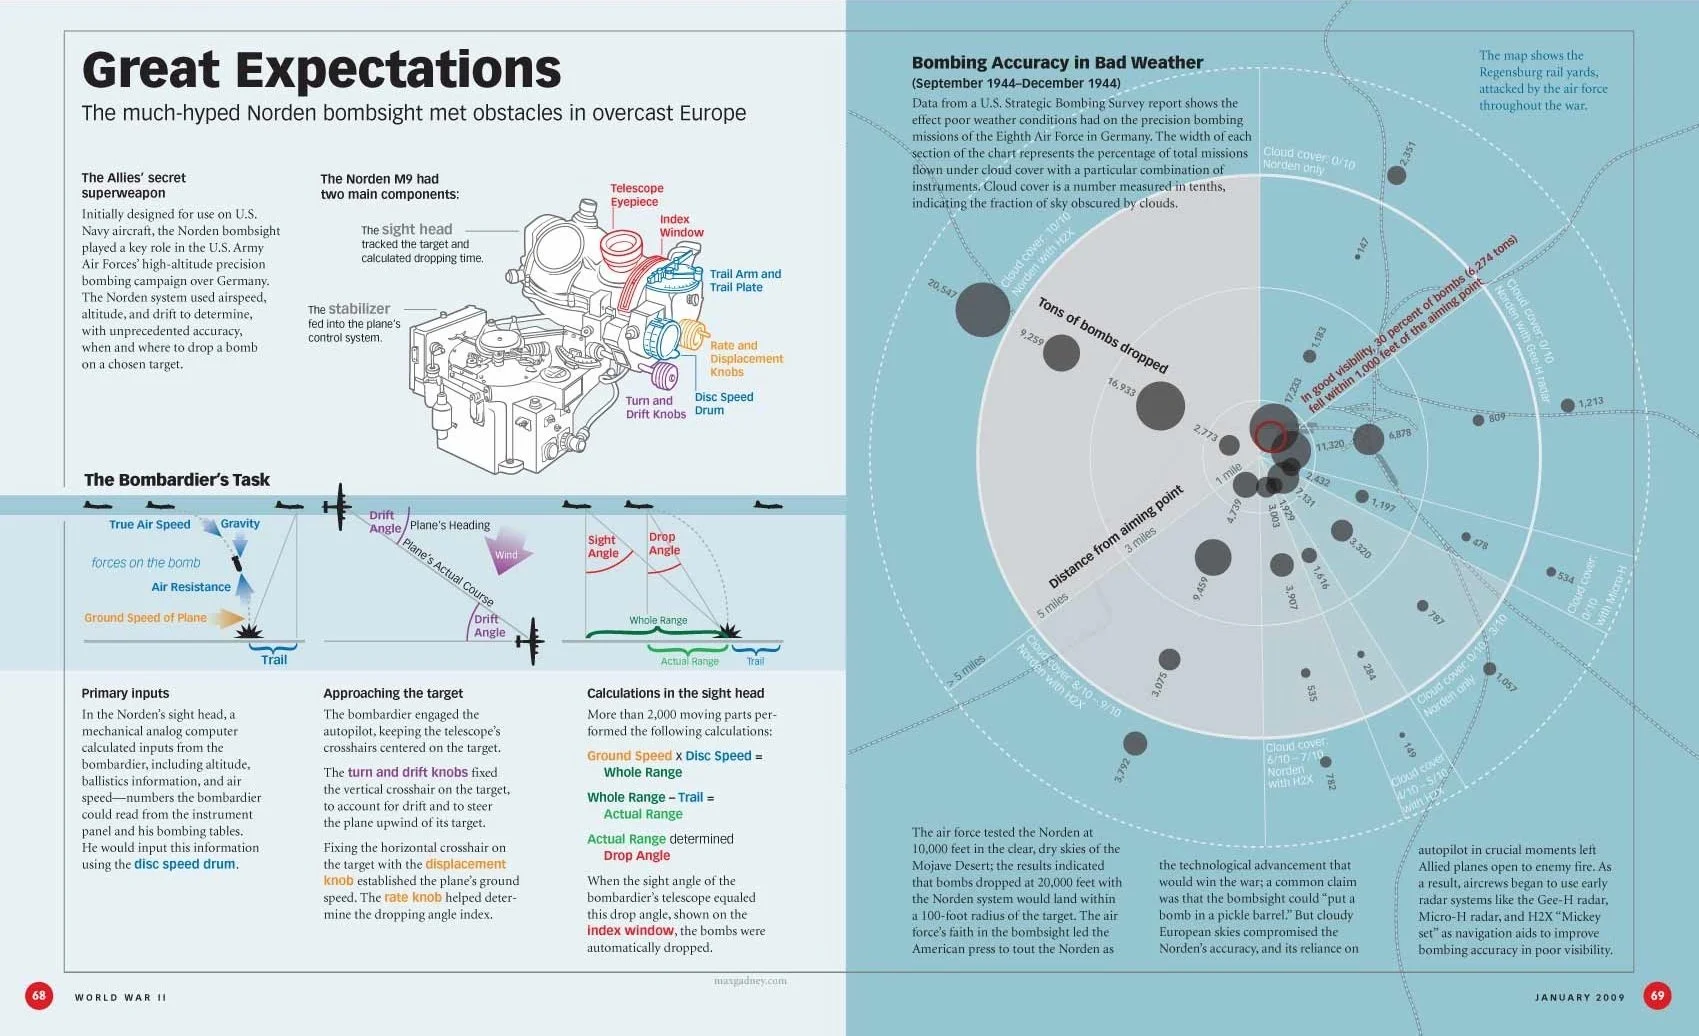
Editorial Graphics
Information graphics for the Weider History Group — researched, written, and illustrated — winning awards alongside National Geographic.
Client
Weider History Group
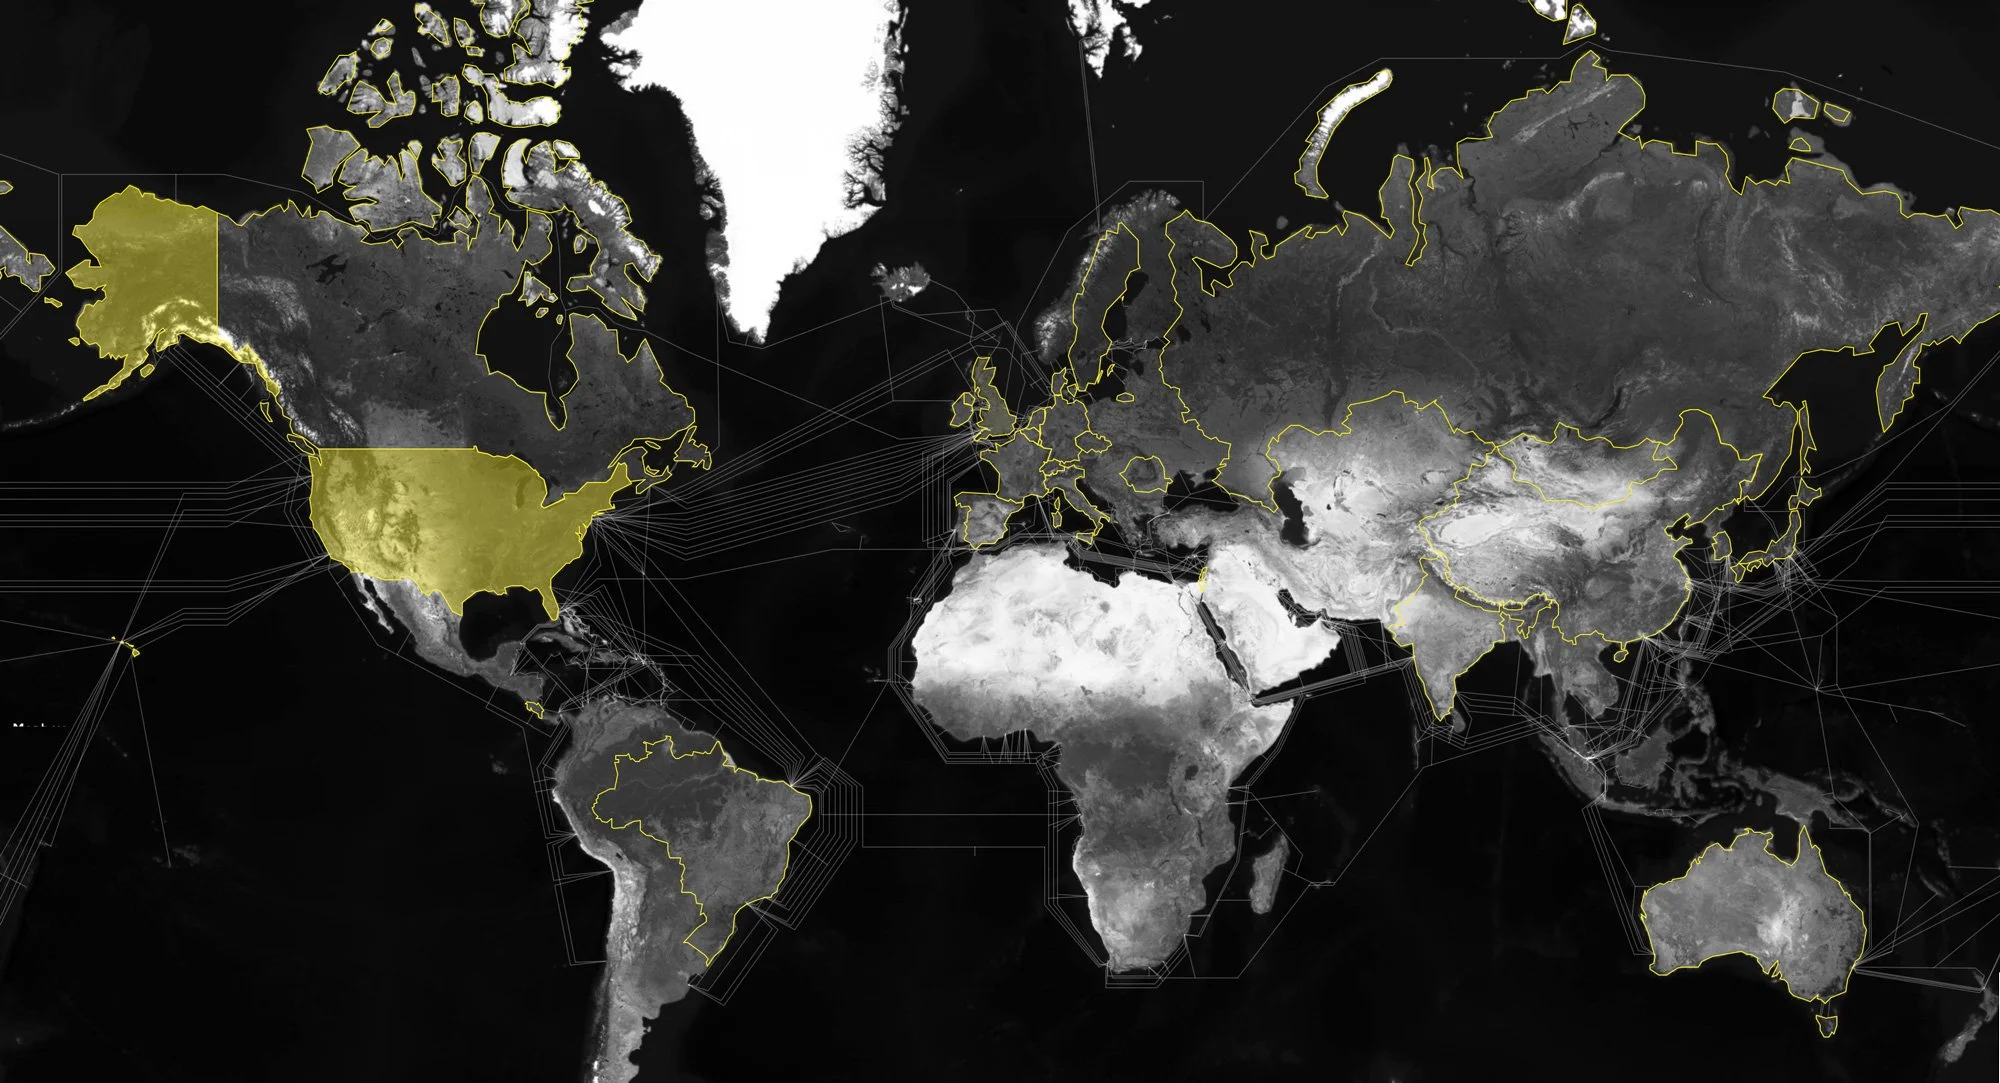
Citizen Ex
A collaboration with artist James Bridle exploring how your data provenance sculpts your national identity.
Client
James Bridle - Artist